


Intelligent Fuel Management Solutions

Fuel Filtration Systems ᛫ Mobile Polishers ᛫ Day Tanks ᛫ Fill Ports ᛫ Fuel & DEF Transfer Systems ᛫ Fuel Metering Systems
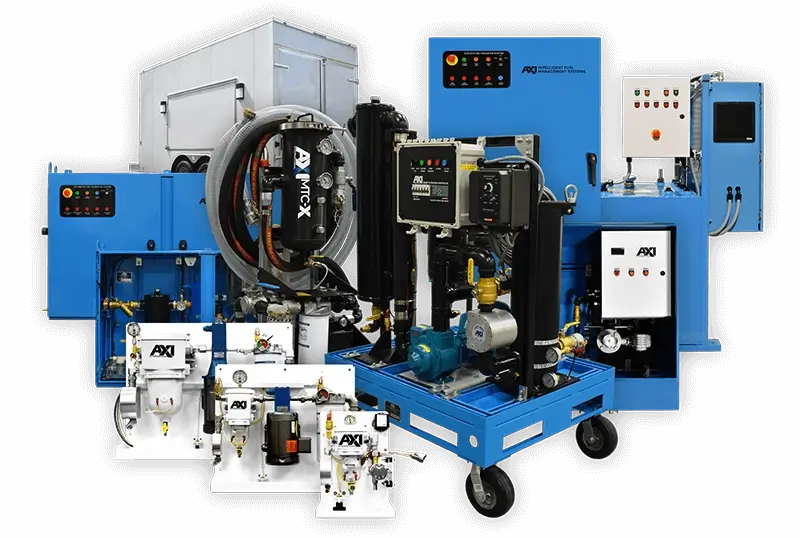

Intelligent Fuel Management Systems
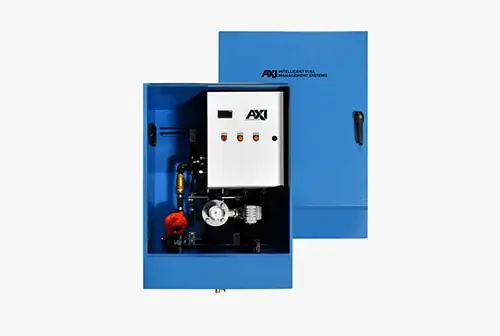
For over 20 years, AXI International has engineered some of the best fuel system solutions with a total fuel management approach in mind. We provide facilities with fully automated systems that seamlessly integrate with each other and the respective facilities they serve. From fuel filling and transfer to ready-use day tank storage and automated filtration, AXI International can effectively cover the full spectrum of your fuel management needs.
For over 20 years, AXI International has engineered some of the best fuel system solutions with a total fuel management approach in mind.
See All Solutions
Engineering Services
AXI International backs its diverse line of fuel management solutions with customer centric engineering services that go beyond product support in seeking to provide the optimal solution(s) for your unique needs.
Fuel Reliability
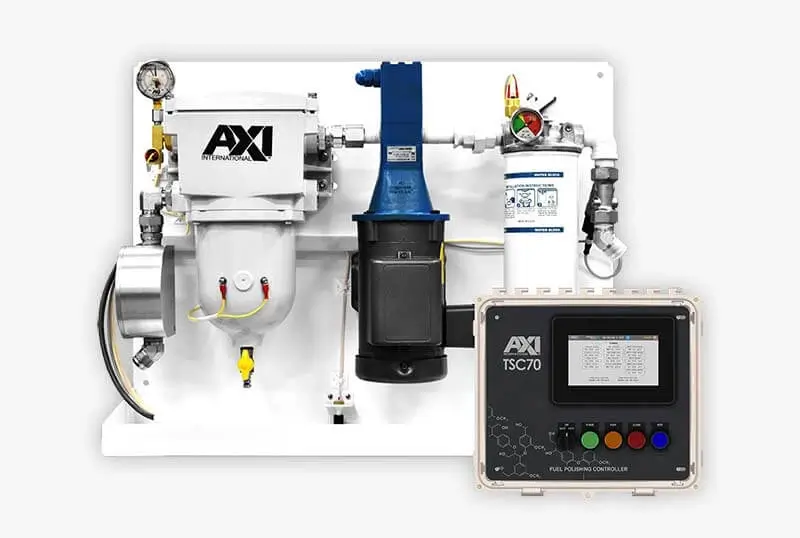
When left untreated, diesel fuel can degrade and develop contaminants that threaten the reliability of the system it is supplying. Premature filter clogging and system wear are some of the major symptoms linked to contaminated fuel. Maintaining fuel cleanliness can help prevent unexpected system maintenance and costly downtime. To learn more about the importance of fuel cleanliness and reliability head over to AXI University for educational articles and videos.
AXI UniversityAXI Ecosystem
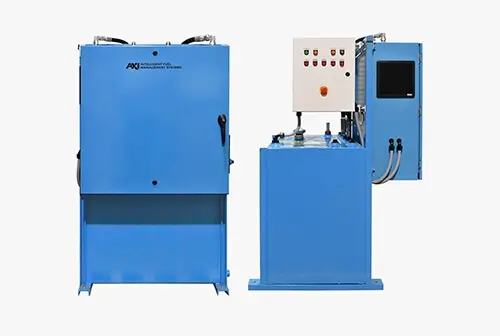
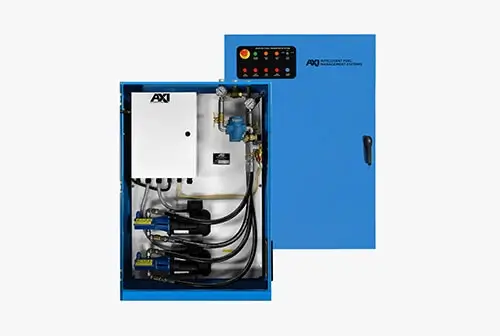
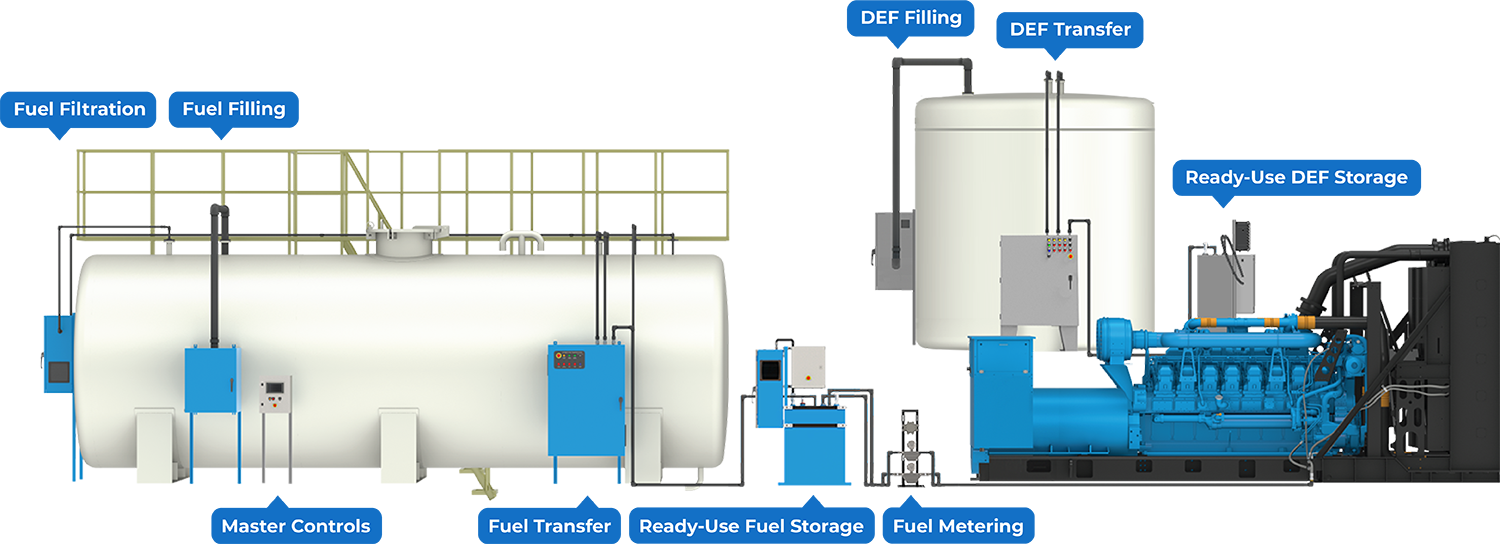
AXI International's systems are designed for plug and play integration among each other to form a complete set of fuel and diesel exhaust fluid (DEF) management solutions.
Stay Up To Date
Keep up with the latest on AXI International's products and services.
Engineering Services
Products
Resource Center
Information

All company names, logos, and brands are property of their respective owners. Use of these names, logos, and brands does not imply endorsement.
Copyright © 2024 AXI International | All Rights Reserved.
Copyright © 2024 AXI International | All Rights Reserved.